Data analysis
Notes from my course in advanced stats and research methods using SPSS
Texts on survey/sampling
- Cochran WG (1977) Sampling Techniques 3rd edition Wiley
- Dillman DA, Smyth JD, Christian LM (2009) Internet, Mail Mixed-Mode Surveys: The
- Tailored Design Method 3rd edition John Wiley & Sons
- Fowler Jr FJ (1995) Improving Survey Questions: Design and Evaluation Sage Publications
- Groves RM, Fowler Jr FJ, Couper MP, Lepkowski JM, Singer E, Tourangeau R (2009) Survey Methodology 2nd edition John Wiley & Sons
- Kish L (1995) Survey Sampling John Wiley & Sons
- Lohr SL (1999) Sampling: Design and Analysis 2nd edition Duxbury Press
- Lumley T (2010) Complex Surveys: A Guide to Analysis Using R John Wiley & Sons
(from review of “Analysis of Questionnaire Data with R” by Ronald D. Fricker, Jr.
Variables
- in experimental research
- independent variable is what we think is a cause, value does not depend on other variables
- dependent, depends on the cause
- in cross-sectional research (“natural experiments”?)
- predictor variable
- outcome variable
(in cross-sectional data, we can make predictions about other variables without implying causality)
Level of measurement: relationship between what is being measured and the numbers that represent what is being measured
Kinds
- categorical
- species, etc. exclusionary
- binary: yes/no, etc
- nominal: when two things that are equivalent in some sense are given the same name (or number), but there are more than two possibilities
- ordinal: nominal + variables are ordered (but we don't know anything about the difference between the values)
- continuous
- a score for each person, can take any value in the measurement scale we are using
- interval variable: we must be certain that equal intervals on the scale represent equal differences in the property being measured (ie. difference from rating a professor 1-3, should be the same as difference between 3-5 points)
- ratio variable: interval + scale must have true and meaningful zero point, lecturer rated 4 is twice as helpful as lecturer rated 2 (ex: reaction time)
- discreteness
- truly continuous variable: can be measured to any level of precision
- discrete variable: can only take certain values (usually whole numbers) on the scale, (ex: age in years)
Measurement error
- validity
- criterion validity: whether the instrument is measuring what it claims to measure
- content validity: the degree to which individual items represent the construct being measured, and cover the full range of the construct
- ecological validity: measures of the variables should not be biased by the researcher being there
- reliability
- the ability of the measure to produce the same results under the same conditions
- test–retest reliability: test the same group of people twice: a reliable instrument will produce similar scores at both points in time
- can also use statistics to determine reliability (for things that vary, so test-retest cannot be used)
Self-report data (rating), ordinal or continuous? If someone gives four points, you don't know if they liked it “twice as much” as someone who gave two points. Ie. should be ordinal, but often analyzed as continuous.
Correlational research methods
two ways to test a hypothesis
- observing what naturally happens (correlational / cross-sectional)
- manipulating environment (experimental)
David Hume on cause and effect:
- cause and effect must occur close together in time (contiguity);
- the cause must occur before an effect does
- the effect should never occur without the presence of the cause
measuring variables simultaneously, provides no info on the contiguity between different variables.
confounding variables - tertium quid (extraneous thing or person)
John Stuart Mill, further criteria: that all other explanations of cause-effect be ruled out
Controlled experiment
Mill’s ideas can be summed up by saying that the only way to infer causality is through comparison of two controlled situations: one in which the cause is present and problem with correlational evidence: the tertium quid (‘a third person or thing of indeterminate character’). For example, a correlation has been found between having breast implants and suicide (Koot, Peeters, Granath, Grobbee, & Nyren, 2003). However, it is unlikely that one in which the cause is absent. This is what experimental methods strive to do: to provide a comparison of situations (usually called treatments or conditions) in which the proposed cause is present or absent.
page 49
Graphs
histogram only for continuous
box plots for outliers
—
lecture 3
portfolio:
- description of data set in general (if you are just pulling some variables) - focus on these aspects
- talk about categorical first, then continuous
- sample size, n is italicized (APA)
- mean, M, s.d.
- PDF the output-file
- code book
Hypothesis testing for one sample and two samples
t-tests
- one sample
- whether mean on a test variable is significantly different from a constant called a test value (by default = 0, indicate it in SPSS)
- two samples (males/females)
- independent
- difference between means of two independent groups
- related
- whether mean of the difference between the two variables is significantly different from zero
one sample t-test
Example
16 lab rats to examine effects of new drug. They eat 10 grams every day (normally) (u = 10), effected expect is to reduce food intake. Works or not?
H0: food consumption is not reduced (u = 10) Ha: Food consumption is reduced (u = 10)
Conditions
Need to evaluate whether the mean on a test variable is significantly different from a constant called a test value
Test value:
- average value of test variable based on past research
- midpoint on test variable (like Likert) (comparing scores on world leaders)
- chance level of performance on the test variable (multiple choice with 4 choices, chance value = 25%)
would not do it on a categorical variable
Assumptions
- observations are independent from each other
- observations represent a random sample from a population
- test variable is normally distributed in the population
What if they are violated?
- inaccurate p-value will be produced if the assumption of independence is violated
- power may be reduced if the population distribution is non-normal (thick-tailed and heavily skewed)
- inferences to the population may ot be valid if the sample is not random
Checking assumptions
Computations
Measures of effect size
SPSS example
#!/bin/bash
java -cp $(dirname $0)/drake.jar drake.core $@ Factual/drake · GitHub [https://github.com/]
One of the most common problems in personality research is to combine a set of items into a scale. Questions to ask of these items and the resulting scale are a) what are the item means and variances. b) What are the intercorrelations of the items in the scale. c) What are the correlations of the items with the composite scale. d) what is an estimate of the internal consistency reliability of the scale. (For a somewhat longer discussion of this, see the internal structure of tests.) Untitled Document
Alternatively, this same analysis could have been done using the alpha function from the psych package:
E1.df ← with(items,data.frame(q_262 ,q_1480 ,q_819 ,q_1180 ,q_1742 ))
#another way to create the data.frame
alpha(E1.df,keys=c(1,-1,1,-1,1)) #the keys vector specifies that two items are reverse scored. Untitled Document
Core R includes a maximum likelihood factor analysis function (factanal) and the psych package includes five alternative factor extraction options within one function, fa. Untitled Document
There are multiple ways to determine the appropriate number of factors in exploratory factor analysis. Routines for the Very Simple Structure (VSS) criterion allow one to compare solutions of varying complexity and for different number of factors. Alternatives include the scree test. To use these routines on a data set with items, myitems,:
library(psych)
my.vss ← VSS(mydata,n=8,rotate=“none”,diagonal=FALSE,…) #compares up to 8 factors
op ← par(mfrow=c(1,2)) #make a two panel graph
VSS.plot(my.vss) #shows a simple summary of VSS
VSS.scree(cor(mydata),main=“scree plot of principal components of mydata”) Untitled Document
Omega: General Factor Saturation of a test
McDonald has proposed coefficient omega as an estimate of the general factor saturation of a test. Zinbarg, Revelle, Yovel and Li (2005) compare McDonald's Omega to Chronbach's alpha and Revelle's beta. They conclude that omega is the best estimate. (See also Zinbarg et al., 2006)
One way to find omega is to do a factor analysis of the original data set, rotate the factors obliquely, do a Schmid Leiman transformation, and then find omega. Here we present code to do that. This code is included in the psych package Untitled Document
Factor rotations
Rotations available in the basic R installation are Varimax and Promax. A powerful additional set of oblique transformations including Oblimin, Oblimax, etc. are available in the GPArotations package from Cran. Untitled Document
Cluster Analysis
A common data reduction technique is to cluster cases (subjects). Less common, but particularly useful in psychological research, is to cluster items (variables). This may be thought of as an alternative to factor analysis, based upon a much simpler model. The cluster model is that the correlations between variables reflect that each item loads on at most one cluster, and that items that load on those clusters correlate as a function of their respective loadings on that cluster and items that define different clusters correlate as a function of their respective cluster loadings and the intercluster correlations. Essentially, the cluster model is a factor model of complexity one (see VSS).
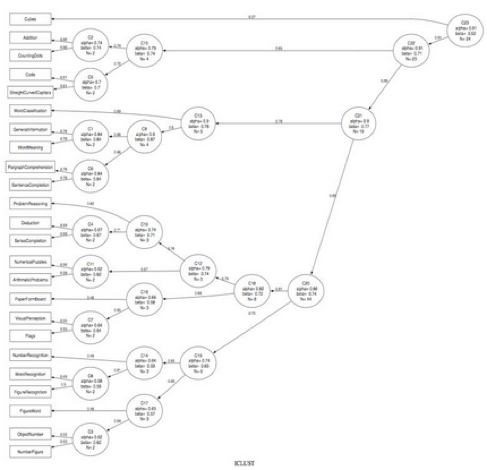
An example of clustering variables can be seen using the ICLUST algorithm to the 24 tests of mental ability of Harman and then using the Graphviz program to show the results.
r.mat← Harman74.cor$cov
ic.demo ← ICLUST(r.mat)
ICLUST.graph(ic.demo,out.file = ic.demo.dot) Untitled Document
Multidimensional scaling
Given a set of distances (dis-similarities) between objects, is it possible to recreate a dimensional representation of those objects?
Model: Distance = square root of sum of squared distances on k dimensions dxy = √∑(xi-yi)2
Data: a matrix of distances
Find the dimensional values in k = 1, 2, … dimensions for the objects that best reproduces the original data.
Example: Consider the distances between nine American cities. Can we represent these cities in a two dimensional space.
See the pages on multidimensional scaling and Thurstonian scaling.
Jan de Leeuw at UCLA is converting a number of mds packages including the ALSCAL program for R. See his page at http://www.cuddyvalley.org/psychoR/code. ALSCAL generalizes the INDSCAL algorithm for individual differences in multiple dimensional scaling. Untitled Document
Structural Equation Modeling
Structural equation models combine measurement models (e.g., reliability) with structural models (e.g., regression). The sem package, developed by John Fox, allows for some basic structural equation models. To use it, add the sem package.
Structural Equation Modeling may be thought of as regression corrected for attentuation. The sem package developed by John Fox uses the RAM path notation of Jack McCardle and is fairly straightforward. Fox has prepared a brief description of SEM techniques as an appendix to his statistics text. The examples in the package are quite straightforward. A text book, such as John Loehlin's Latent Variable Models (4th Edition) is helpful in understanding the algorithm.
Demonstrations of using the sem package for several of the Loehlin problems are discussed in more detail on a separate page. In addition, lecture notes for a course on sem (primarily using R) are available at the syllabus for my sem course.
Multilevel Models/ Hierarchical Level Models
HLM can be done using the lme package. See the discussion in the R newsletter, Vol 3/3 by Lockwood, Doran, and McCaffrey. Also see the relevant pdf appendix of John Fox's text on applied regression. I have not yet tried out these techniques.
Item Response Theory using R
Item Response Theory is a model that considers individual differences in ability as well as item difficulty. It is sometimes called the “new” psychometrics (as contrasted to “classic” psychometrics of traditional test theory.) Essentially, classic psychometrics estimates person scores by assuming items are random replicates of each other. Precision of measurement is expressed in terms of the reliability which is the ratio of “true” score variance to total test variance. Reliability is thus a between person concept. IRT estimates person scores as well as item difficulty (endorsement) scores. Precision of measurement may be estimated in terms of the patterns of scores of a single individual and does not require between person variability. Although the “new” and “classic” psychometrics give very similar estimates of person scores, the ability to do tailored tests and to consider the metric properties of the scales makes IRT very useful. IRT models differ in their complexity. The one parameter model assumes items all have equal discriminability and differ only in their difficulty. The two parameter model assumes items differ in difficulty and discriminability, the three parameter model assumes items differ in the ease of guessing. Although developed for binary items (correct versus incorrect), generalizations of IRT to multiresponse formats are very useful.
For a detailed demonstration of how to do 1 parameter IRT (the Rasch Model) see Jonathan Baron and Yuelin Li's tutorial on R. A more useful package for latent trait modeling (e.g., Rasch modeling and item response theory) (ltm) has now been released by Dimitris Rizopoulos. Note that to use this package, you must first install the MASS, gtools, and msm packages.
The ltm package allows for 1 parameter (Rasch) and two parameter (location and discrimination) modeling of a single latent trait assessed by binary items varying in location and discrimination. Procedures include graphing the results as well as anova comparisons of nested models. Untitled Document
Very intro (like, Stats 101 intro): Purves, Pisani, and Freedman's is the best book I've seen. I'd combine that with something like Tufte's or Wainer's statistical graphics books to try to get some sophistication (for lack of a better word). Statistical Formulas For Programmers | Hacker News
I like the NIST/SEMATECH e-Handbook of Statistical Methods (http://www.itl.nist.gov/div898/handbook/).
The e-Handbook won't make you an expert statistician, but as an engineer needing to understand and apply statistical methods, I've found it to be a good starting point. Statistical Formulas For Programmers | Hacker News
Robust Statistics: https://en.wikipedia.org/wiki/Robust_statistics Statistical Formulas For Programmers | Hacker News
Larger Cover
Doing Data Science Doing Data Science - O'Reilly Media
As an alternative for anyone who wants to delve a little further into data mining, I'm currently taking the Stanford data mining class, STATS202. The book we're using has been really great (published this year) and covers a great deal more than this site seems to. It's called “An Introduction to Statistical Learning with Applications in R.” It's free online through the Stanford libraries, but I'm not sure about accessing it for free elsewhere. The lectures are also probably recorded online somewhere, if anyone is really interested. A Programmer's Guide to Data Mining | Hacker News
Check out gensim if you want to do topic modeling or similarity comparisons in Python.
http://radimrehurek.com/gensim/
It has good implementations of various algorithms, some of which support streaming or dirstribution, and it allows loading and dumping data in various formats.
I've used it for building content based recommender using tf-idf, lsi and similarity index. After the index is built, queries to it are really fast. It can handle quite large corpuses with little memory. A Programmer's Guide to Data Mining | Hacker News
[−]ville 3 hours ago | link
This looks nice. I've also heard many recommendations for the book Programming Collective Intelligence[1], which touches the same subjects and also has examples in Python. Now I'm tempted to read both :)
[1]: http://shop.oreilly.com/product/9780596529321.do
reply A Programmer's Guide to Data Mining | Hacker News
[−]samuel 5 minutes ago | link | parent
Take a look to «building machine learning systems with python». It's a great read. If you are interested I reviewed it at O'Reilly's site. A Programmer's Guide to Data Mining | Hacker News
Below is a list of Further Readings from my book, with comments on each publication.
Bernardo, JM and Smith, A, (2000) 4 . Bayesian Theory A rigorous account of Bayesin methods, with many real-world examples.
Bishop, C (2006) 5 . Pattern Recognition and Machine Learning. As the title suggests, this is mainly about machine learning, but it provides a lucid and comprehensive account of Bayesian methods.
Cowan G (1998) 6 . Statistical Data Analysis. An excellent non-Bayesian introduction to statistical analysis.
Dienes, Z (2008) 8 . Understanding Psychology as a Science: An Introduction to Scientific and Statistical Inference. Provides tutorial material on Bayes’ rule and a lucid analysis of the distinction between Bayesian and frequentist statistics.
Gelman A, Carlin J, Stern H, and Rubin D. (2003) 14 . Bayesian Data Analysis. A rigorous and comprehensive account of Bayesian analysis, with many real-world examples.
Jaynes E and Bretthorst G (2003) 18 . Probability Theory: The Logic of Science. The modern classic of Bayesian analysis. It is comprehensive and wise. Its discursive style makes it long (600 pages) but never dull,and it is packed ful l of insights.
Khan, S, 2012, Introduction to Bayes’ Theorem. Salman Khan’s online mathematics videos make a good introduction to various topics, including Bayes’ rule.
Lee PM (2004) 27 . Bayesian Statistics: An Introduction. A rigorous and comprehensive text with a strident Bayesian style.
MacKay DJC (2003) 28 . Information theory, inference, and learning algorithms. The modern classic on information theory. A very readable text that roams far and wide over many topics, almost all of which make use of Bayes’ rule.
Migon, HS and Gamerman, D (1999) 30. Statistical Inference: An Integrated Approach. A straightforward (and clearly laid out) account of inference, which compares Bayesian and non-Bayesian approaches. Despite being fairly advanced, the writing style is tutorial in nature.
Pierce JR (1980) 34 2nd Edition. An introduction to information theory: symbols, signals and noise. Pierce writes with an informal, tutorial style of writing, but does not flinch from presenting the fundamental theorems of information theory.
Reza, FM (1961) 35 . An introduction to information theory. A more comprehensive and mathematical ly rigorous book than the Pierce book above, and should ideally be read only after first reading Pierce’s more informal text.
Sivia DS and Skilling J (2006) 38 . Data Analysis: A Bayesian Tutorial. This is an excellent tutorial style introduction to Bayesian methods.
Spiegelhalter, D and Rice, K (2009) 36 . Bayesian statistics. Scholarpedia, 4(8):5230. http://www.scholarpedia.org/article/Bayesian_statistics A reliable and comprehensive summary of the current status of Bayesian statistics.
And, here is my book, published June 2013.
Bayes' Rule: A Tutorial Introduction to Bayesian Analysis, Dr James V Stone, ISBN 978-0956372840
Chapter 1 can be downloaded from: http://jim-stone.staff.shef.ac.uk/BookBayes2012/BayesRuleBookMain.html books - What is the best introductory Bayesian statistics textbook? - Cross Validated
Machine Learning: The Art and Science of Algorithms that Make Sense of Data by Peter Flach (ISBN 1107422221)
Pattern Recognition and Machine Learning by Chris Bishop (ISBN 0387310738)
Machine Learning by Tom Mitchell (ISBN 0070428077)
Elements of Statistical Learning by Trevor Hastie, Robert Tibshirani and Jerome Friedman (ISBN 0387952845)
Information Theory, Inference and Learning Algorithms by David MacKay (ISBN 0521642981)
An Introduction to Computational Learning Theory by Michael Kearns and Umesh Vazirani (ISBN 0262111934) Machine Learning (CMSC 422) - Spring 2013

