Principal component analysis
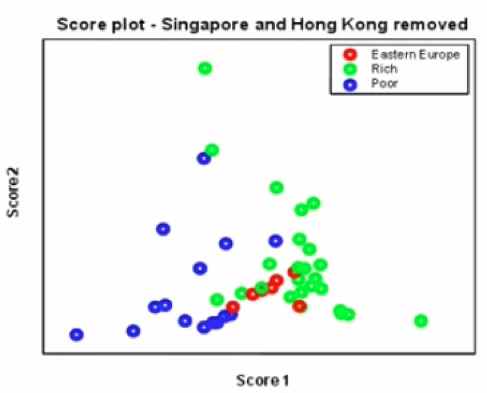
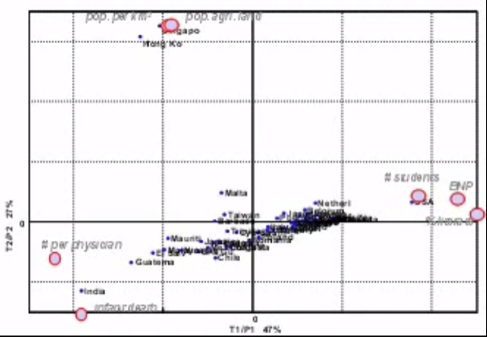
Tries to reduce the number of variables to express as much of the variation as possible (can be used to analyze questionnaires, but many other things as well). Plot the variables as axis (three variables in a 3D scatter-plot) and then try to rotate the plane. The result is a bi-plot with loadings which shows both where the items end up, and the loadings of the variables. Items that are similar are close to each other. Variables close to the centre make little difference, variables close to each other covary (one of them could be reduced without much loss). Variables opposite to each other have a negative correlation. Plots below were generated with Matlab.
Very useful for exploratory data analysis, the “island” direction would probably not have been noticed had we just chosen a few variables to scatterplot.
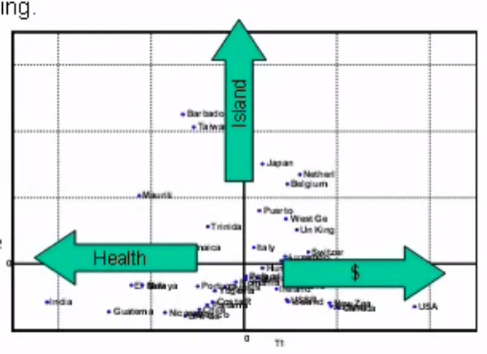
Can also visualize groupings quickly (gender, etc):