Student Model Tools R1
| Johnson, M., Vatrapu, R., Bull, S., Teplovs, C., & Reimann, P. (2011). Student Model Tools R1. NEXT-TELL. |
BibTex
BibTex
@book{johnson2011student,
author = {Johnson, Matthew and Vatrapu, Ravi and Bull, Susan and Teplovs, Christopher and Reimann, Peter},
date = {August 2011},
date-added = {2011-11-21 01:54:09 +0000},
date-modified = {2011-11-23 01:24:57 +0000},
keywords = {NEXT-TELL},
publisher = {NEXT-TELL},
read = {1},
title = {Student Model Tools R1},
year = {2011},
bdsk-file-1 = {YnBsaXN0MDDUAQIDBAUIJidUJHRvcFgkb2JqZWN0c1gkdmVyc2lvblkkYXJjaGl2ZXLRBgdUcm9vdIABqAkKFRYXGyIjVSRudWxs0wsMDQ4RElpOUy5vYmplY3RzViRjbGFzc1dOUy5rZXlzog8QgASABoAHohMUgAKAA1lhbGlhc0RhdGFccmVsYXRpdmVQYXRo0hgMGRpXTlMuZGF0YU8RAYgAAAAAAYgAAgAAB1NTREhvbWUAAAAAAAAAAAAAAAAAAAAAAAAAAMl5T9hIKwAAANrWUhZqb2huc29uMjAxMXN0dWRlbnQucGRmAAAAAAAAAAAAAAAAAAAAAAAAAAAAAAAAAAAAAAAAAAAAAAAAAAAAAAAGafVqy9cm1VBERiBDQVJPAAIAAgAACSAAAAAAAAAAAAAAAAAAAAAHQmliZGVzawAAEAAIAADJeZYoAAAAEQAIAADL118VAAAAAQAMANrWUgAXPTEAAZ9eAAIANVNTREhvbWU6VXNlcnM6AFN0aWFuOgBCaWJkZXNrOgBqb2huc29uMjAxMXN0dWRlbnQucGRmAAAOAC4AFgBqAG8AaABuAHMAbwBuADIAMAAxADEAcwB0AHUAZABlAG4AdAAuAHAAZABmAA8AEAAHAFMAUwBEAEgAbwBtAGUAEgAqVXNlcnMvU3RpYW4vYmliZGVzay9qb2huc29uMjAxMXN0dWRlbnQucGRmABMAAS8AABUAAgAM//8AAIAF0hwdHh9YJGNsYXNzZXNaJGNsYXNzbmFtZaMfICFdTlNNdXRhYmxlRGF0YVZOU0RhdGFYTlNPYmplY3RfECQuLi8uLi9iaWJkZXNrL2pvaG5zb24yMDExc3R1ZGVudC5wZGbSHB0kJaIlIVxOU0RpY3Rpb25hcnkSAAGGoF8QD05TS2V5ZWRBcmNoaXZlcgAIABEAFgAfACgAMgA1ADoAPABFAEsAUgBdAGQAbABvAHEAcwB1AHgAegB8AIYAkwCYAKACLAIuAjMCPAJHAksCWQJgAmkCkAKVApgCpQKqAAAAAAAAAgEAAAAAAAAAKAAAAAAAAAAAAAAAAAAAArw=}
}
Links here
Highlights (8%)
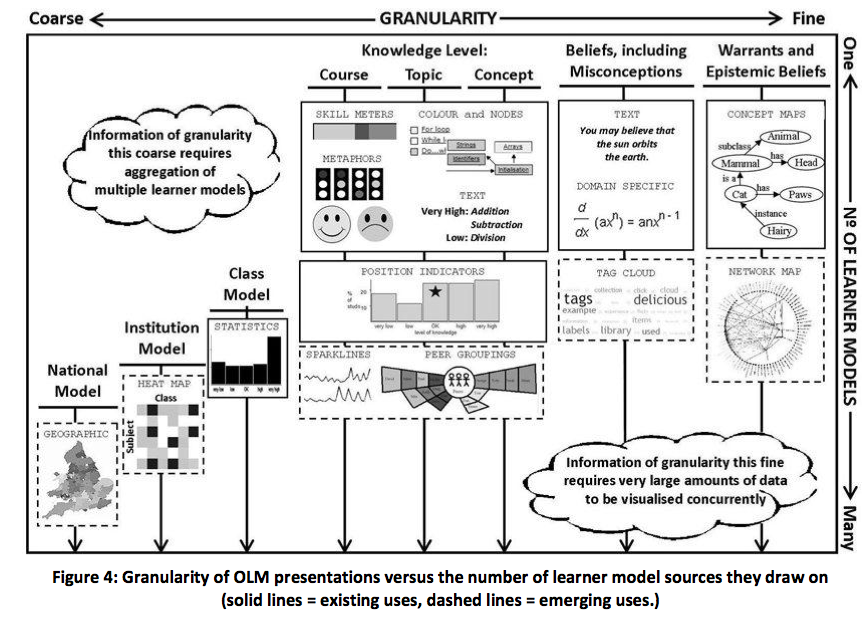
There is a clear diagonal trend in information that may be presented with sufficient clarity. Information that is very fine-grained may be easily represented for single and small groups of students (top right), for use in the classroom or at home. However, it is more difficult to visualise large numbers of beliefs, which for the most part may be pseudo-unique and domain-specific (bottom right). Information that draws on such a large number of learner models may be presented clearly with very coarse granularity, for example at a national level, using geographic information (bottom left). Information this coarse requires many learner models to allow meaningful inferences to be made: for example, presenting information about the progress of different class groups in a school. To date, most work on open learner modelling has focussed on opening the learner model to individual or relatively small groups of students, using knowledge level and belief information (top middle/right), and so emerging open learner model presentations are those that visualise data pertaining to greater numbers of students. In NEXT-TELL, stakeholders are to use OLM information in new contexts (e.g., in real time, to influence classroom activities; to see how student progress compares to other students at a national level), which mandates state-of-the art visualisation methods be used to present information clearly, in alignment with current practices and pedagogical strategies. Methods such as tag clouds, network maps and sparklines will be important in aggregating information that may be interpreted ‘at a glance’. p. 10
Since learners perceive and act upon representations of their learning in OLM systems, the notational, emotional, informational and interactive aspects of representations must be considered in the design and development of OLM systems. p. 33
Representation as a proxy to information plays a crucial role in design in general. The nature of representations, their structures and interactions is one of the central concerns of cognitive science (Winn, 2004). Philosophically speaking, the function of representation is to “re-present”. Representation, in the philosophy of mind sense of the term, “is something that stands for something else”. p. 33
perception and appropriation of socio-technical affordances (Vatrapu, 2009, 2010) representational guidance (Suthers, 1999; Suthers & Hundhausen, 2003; Suthers, Vatrapu, Medina, Joseph, & Dwyer, 2008) cognitive dimensions of notations (Blackwell & Green, 2003; Green, 1989) p. 33
The notion of affordance was introduced by J. J. Gibson (1979). Gibson was primarily concerned with providing an ecologically grounded explanation to visual perception. Affordance is a deceptively simple concept that hides a very radical hypothesis. Norman’s introduction of the concept of “perceived affordance” (Norman, 1990) brought the notion of affordance into human computer interaction. Relevant literature includes: Gaver’s seminal articles on technology affordance (Gaver, 1991), affordances of media spaces (Gaver, 1992), affordances for interaction (Gaver, 1996); Bradner’s notion of social affordance (Bradner, 2001); Hartson’s (2003) taxonomy of affordances into physical, sensory, functional and cognitive affordances; McGrenere and Ho’s (2000) critical review of the notion of affordance and a structuration theoretical interpretation of affordances (Vyas, Chisalita, & van der Veer, 2006). Affordances in HCI have largely been misunderstood as widgets, features and functionalities (Torenvliet, 2003), despite a crucial intervention by Norman (1999) himself. p. 34
Definition of Socio-Technical Affordance: By drawing upon ecological psychology research, Vatrapu (2010) defined a socio-technical affordance as : “action-taking possibilities and meaning-making opportunities in a socio-technical system relative to actor competencies and system capabilities.” p. 34
6.1.2 Representational Guidance The system of mental representations “consists not of individual concepts, but of different ways of organizing, clustering, arranging and classifying concepts and of establishing complex relations between them” (Hall, 1997, p. 17). p. 34
From a cultural studies perspective, Stuart Hall (1997) argues that representations connect meaning and language to culture and distinguishes two systems of representations: concepts or mental representations and language. From a cognitive science perspective, Zhang (1997) presented a functional model for the problem solving with external representations. The internalist representational view in cognitive sciences posits an internal representational model of every feature of the external world. Zhang rejects this internalist representational view. Instead, Zhang (1997, p. 181) argues that the internal representations and external representations are cognitively processed “in an interwoven, integrative, and dynamic manner”. Zhang’s definitions for internal and external representations are provided next. p. 34
Definition of Internal Representations. We define internal representations as: “Internal representations are the knowledge and structure in memory, as propositions, productions, schemas, neural networks, or other forms” (Zhang, 1997, p. 180). p. 34
From a cognitive science perspective, during learning activities information inherent in internal representations is retrieved from long-term memory and working memory. p. 34
Definition of External Representations. We define external representations as: “external representations are defined as the knowledge and structure in the environment, as physical symbols, objects, or dimensions (e.g., written symbols, beads of abacuses, dimensions of a graph, etc.), and as external rules, constraints, or relations embedded in physical configurations (e.g., spatial relations of written digits, visual and spatial layouts of diagrams, physical constraints in abacuses, etc.)” Zhang (1997, p. 180) p. 35
External representations embody environmental information, and this information can be “directly picked up” by the human perceptual systems in the Gibsonian ecological approach (Gibson, 1979). p. 35
6.1.3 Cognitive Dimensions of Notations p. 36
The cognitive dimensions framework (Blackwell & Green, 2003; Green, 1989) is highly relevant to understanding the notational aspects of the OLM representations. The cognitive dimensions of representations deal with the cognitive affordances of notations with respect to users engaged in activities. Gibson's ecological optics (Gibson, 1979) and Green and Blackwell's cognitive dimensions (Blackwell & Green, 2003) share conceptual terms such as medium and environment. Cognitive dimensions of representations, like affordances, are about the action-taking possibilities and meaning-making opportunities given actor competencies and system capabilities. p. 36
Information Artefacts: “the tools we use to store, manipulate, and display information” (p.5) Information artefacts are further classified as “non-interactive artefacts” and “interactive artefacts”. p. 36
Environment: “The environment contains the operations or tools for manipulating those marks” (p.8). p. 36
Medium: “The notation is imposed upon a medium, which may be persistent, like paper, or evanescent, like sound”(p.8). p. 36
The cognitive dimensions framework distinguishes four types of user activity. p. 36
Incrementation: “adding further information without altering the structure in any way” (p.10) p. 36
Modification: “changing an existing structure, possibly without adding new content”(p.10) p. 37
Transcription: “copying content from one structure to another structure;”(p.10) p. 37
Exploratory Design: “combining incrementation and modification, with the further characteristic that the desired end state is not known in advance”(p.10) p. 37
Definitions of Cognitive Dimensions. We define cognitive definitions as follows (Green and Blackwell (1998)): p. 37
Abstraction: “An abstraction is a class of entities, or a grouping of elements to be treated as one entity, either to lower the viscosity or to make the notation more like the user’s conceptual structure” (p.24) Closeness of Mapping: “Closeness of representation to domain” (p.39) Consistency: “similar semantics are expressed in similar syntactic forms”(p.39) Diffuseness: “verbosity of language” (p.39) Error-Proneness: “notation invites mistakes” (p.40) Hard Mental Operations: “high demand on cognitive resources” (p.40) Hidden Dependencies: “A hidden dependency is a relationship between two components such that one of them is dependent on the other, but that the dependency is not fully visible” (p.17) Premature Commitment: “Constraints on the order of doing things force the user to make a decision before the proper information is available” (p.21) Progressive Evaluation: “work-to-date can be checked at any time” (p.40) Provisionality: “degree of commitment to actions or marks” (p.41) Role-Expressiveness: “the purpose of a component (or an action or a symbol) is readily inferred” (p.41) Secondary Notation: “Extra information carried by other means than the official syntax” (p.29) Viscosity: “Resistance to change: the cost of making small changes”(p.12) Visibility: “ability to view components easily.”(p.34) Juxtaposability: “ability to place any two components side by side”(p.34) p. 37
Emotional activation is calculated based on the changes in participants’ pupil diameters. Emotional activation measures the level of arousal and engagement towards the stimulus image. The higher the emotional activation measure, greater the emotional impact of it. p. 45
Heatmaps present the spatial distribution of students’ gaze on a particular repertory grid exercise webpage. p. 45
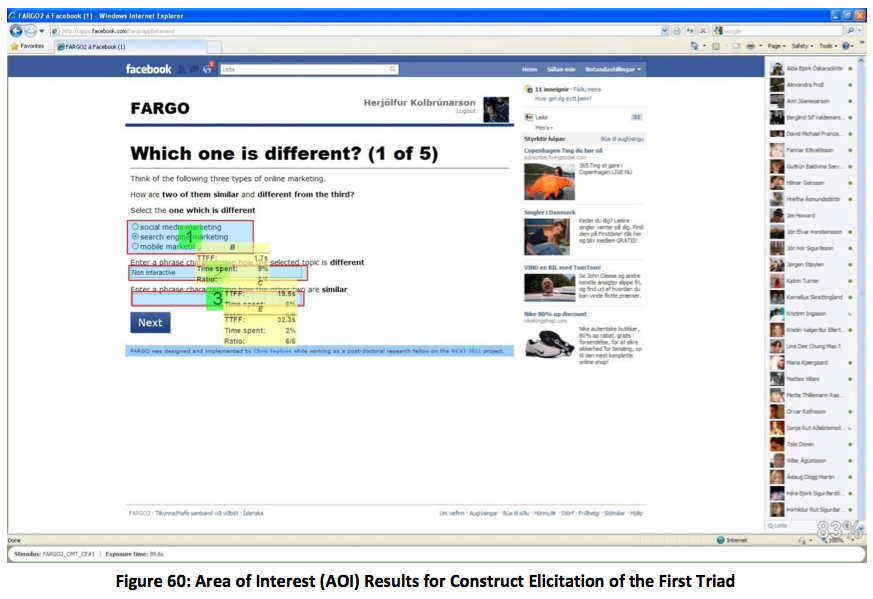
The Area of Interest (AOI) analysis was conducted on regions of the images that were of particular importance from the pedagogical and/or user interface design perspectives. p. 45
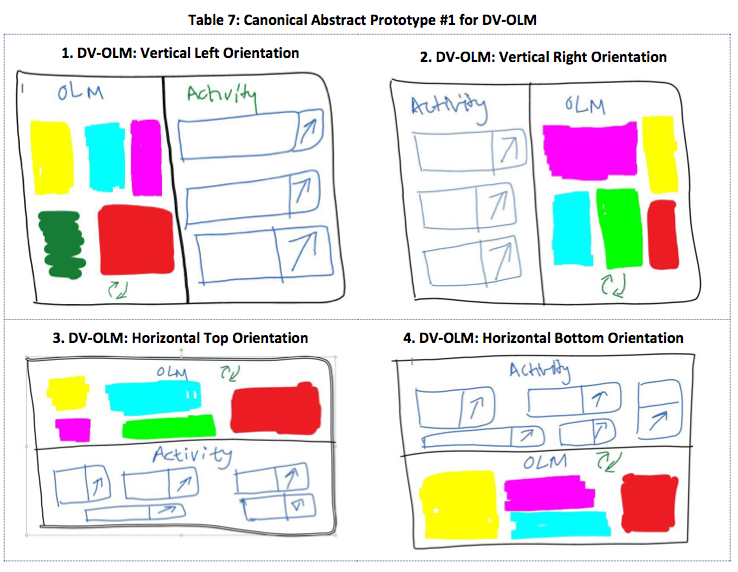
Canonical abstract prototypes “are an extension to usage-centred design that provides a formal vocabulary for expressing visual and interaction designs without concern for details of appearance and behaviour” (Constantine, 2003). p. 60
“Canonical Abstract Prototypes are a model specifically created to support a smooth progression from abstraction toward realisation in user interface design. The impetus for developing them arose from a growing awareness among practitioners of usage centred design regarding the substantial conceptual gap between the task models needed to drive an effective design and the p. 60
detailed, realistic prototypes needed for successful implementation. Particularly on large projects, the need for some intermediate form of representation became acutely apparent. Simple content inventories had proved both too abstract and too imprecise for resolving design issues in very complex user interfaces.” (Constantine, 2003) p. 61
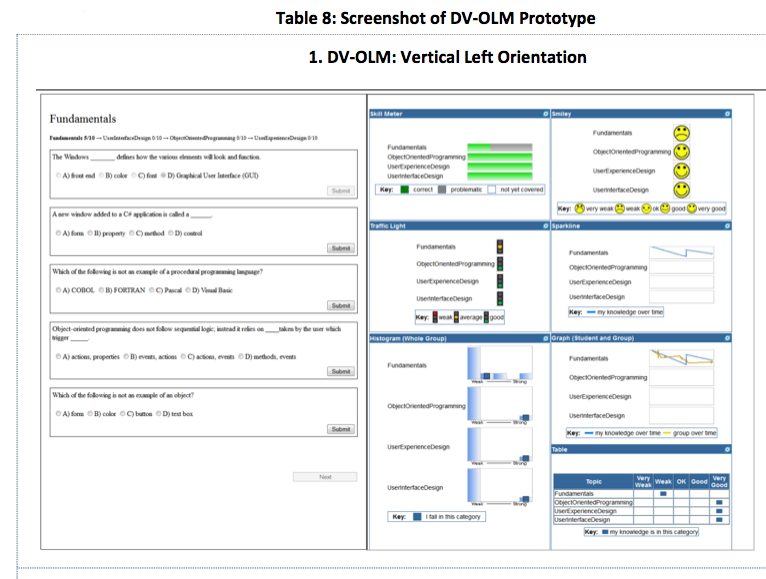
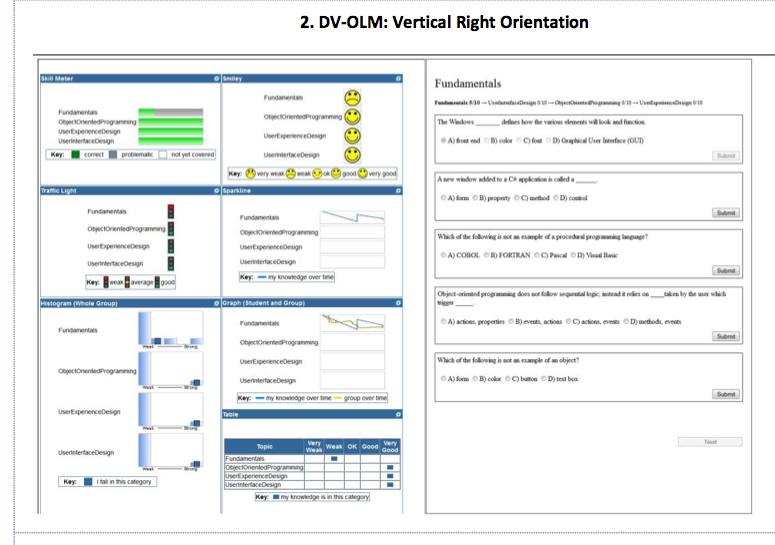
The DV-OLM prototype is designed to complement the Repertory Grids for Formative Assessment (RGFA)6 application by providing a summative evaluation option. The four canonical abstract prototypes were then implemented into the four variants of the Dynamic Visualizations of the Open Learner Models (DV-OLM) application7. p. 61
At the time of writing, a prototype version of the DV-OLM application has been developed to be used for summative assessment in introductory computer science programming. The DV-OLM application is deployed at http://rgfa.cba.dk/DV-OLM and will be used for summative evaluation in a pre-test and post-test design in a p. 61
real world class on mobile application development for the curriculum module on Visual C# programming. This prototype is currently undergoing evaluation and results will be made available in October 2011. p. 62
The repertory grid technique (RGT) is a method for eliciting personal constructs of individuals about elements belonging to the topic of study. RGT is based on the seminal contribution of the personal construct theory of the psychologist George Kelly (Kelly, 1963, 1992) and subsequent theoretical and methodological developments (cf. Adams-Webber, 2006; Fransella, Bell, & Bannister, 2003). RGT has been used by both researchers and practitioners in a wide variety of fields including psychotherapy (Winter, 2003), marketing (Frost & Braine, 1967), education (Bell & Harriaugstein, 1990; Mazhindu, 1992), and information systems (Cho & Wright, 2010; Tan & Hunter, 2002). p. 65
RGT consists of a family of methods and variations involving the nature of the personal construct elicitation and the rating or ranking of elements in monadic, dyadic or triadic configurations (Fransella, et al., 2003). Within the NEXT-TELL project, for the purposes of formative assessment, we have decided to start researching RGT with an implementation of the widely adopted method of triadic sorting of elements for personal construct elicitation and subsequent five-point Likert-item rating of the rest of the elements (Fransella, et al., 2003). In short, the triadic sorting method consists of the participants being presented sets of three elements each. For a given set of three elements, the participant is prompted to select the element that is different from the other two and to state how it is different as the “opposite construct”. Then, the participant is to state how the two remaining elements in the triad are similar to each other as the “similarity construct”. The rest of the elements are then rated on a Likert-item scale ranging from the opposite construct (1) to the similarity construct (5). The participants repeat this process until all the triads of elements are sorted into different and similar and the elements for that comparison are rated. The outcome of this exercise is the repertory grid (RG) consisting of rows consisting of triads, columns consisting of elements with the first column being the opposite construct and the last column being the similarity construct, and the cell values consisting of the ratings given for elements. p. 65
However, the dyadic configuration of “driver” and “navigator” in pair programming and pair analytics creates a bootstrapping problem for learning settings: can we really throw a visual analytics expert (VAE) and teaching expert (TE) together into a classroom setting and expect them to work productively without explicit facilitation, intelligent scaffolding, and guided design? Facilitating interaction is a role that can be fulfilled by a design- based research expert (DBRE). p. 66
Eliciting criteria for teaching analytics involves a collocated collaborative triad of a teaching expert (TE), a visual analytics expert (VAE), and a design-based research expert (DBRE) analysing, interpreting and acting upon data being generated by students’ learning activities by using a range of visual analytics tools. p. 67
We think of the relationships between the TE, VAE and DBRE as a dynamic socio-technical system. The design considerations are about creating feedback loops between the three individuals, such that each one drives the other two to higher levels of performance on the positive side (with the cost of anxiety in the negative case). That is, feedback from the teacher inspires the VAE to create new, better visualizations and for the researcher to better understand the on-going teaching and learning processes while feedback from the VAE – perhaps in the form of visualization artefacts – allows the teachers to better understand what is going on in the classroom from a learning activity design perspective and the research to hypothesise, test and predict student learning trajectories and performance outcomes. All in all, these feedback loops should culminate in the teacher providing timely, meaningful actionable, customized and personalized feedback to students. The key point here is that each member of the triumvirate of TE, VAE, and DBRE can gain from the other two, not that each partner's role is to highlight deficiencies of the other two. p. 67
There are three interdependent research and development objectives for the use of repertory grid technique for technology enhanced formative assessment. p. 67
1. Integration of repertory grid into the curriculum as an in-class learning activity or a take-home exercise. p. 67
2. Methodological support for teachers to designing and deploying RGT exercises. p. 67
3. Computational support for visualizing the repertory grid data at the individual student and whole classroom level for formative assessment purposes for teachers and self- and collaborative learning purposes for students. p. 67
A Facebook application called “formative assessment using repertory grid online” (FARGO) was developed towards this purpose. p. 68
The first implementation of FARGO was designed to support formative assessment of students’ prior knowledge of consumer decision-making before the scheduled lecture on consumer psychology. The objective was to adapt the online lecture teacher based on the Repertory Grid data and to link the FARGO exercise on consumer decision making to the decision heuristics simulations exercise designed for students to gain familiarity with behavioural economics. p. 68
two studies, one with ten kinds of shopping (shoes, tickets etc), and one with lot's of kinds of advertising, in three triads. p. 70
Regarding the content of the exercise, students who had domain knowledge of consumer psychology through prior courses felt that the exercise was less interesting compared to students without prior knowledge of the exercise topic p. 73
Based on the results reported in the previous section, the preliminary finding is that repertory grid technique with triadic sorting is a promising candidate for technology enhanced formative assessment. p. 91
In designing repertory grid exercises, teachers should pay particular attention to the previous domain knowledge of students and to what extent the elicited constructs are grounded in the personal lived experience of the students compared to the domain knowledge. p. 91
9 References p. 95
Images
p. 6
p. 6
p. 11

p. 26
p. 27
p. 29

p. 30
p. 61
p. 62
p. 62
p. 79

