Introduction to Data Mining workshop
with Chris Brooks and Zach Pardos
Workshop page. Using Weka
k-means clustering and J48 decision tree classification – they are interpretable. (Some machine learning algorithms generate “black boxes” which work, but don't explain).
Resources
- Upcoming EdX MOOC by George Siemens, etc this fall
Clustering
Grouping of like instances based on their properties. Generally in unsupervised manner, where human expert labels clusters.
Often use it when we don't have educational theories to guide us in our investigation.
k-Means
- Consider a list of students in a 2 feature space (eg. GPA and age)
- Goal is to find “best” k (eg. 3) clusters in data
- Models are usually descriptive
- How do you pick k? Often based on exploration, also some more principled ways.
Assumption: independence of features. Algorithm assumes that, but often not a reasonable assumption.
Pros:
- fast enough for complex datasets
- easy to interprt
Cons:
- sensitive to initial values
- usually repeat process many times with random k values
- how to choose initial k, how many clusters do you expect to find?
- intuition
- experimentation
- pedagogical theory
- elbow
You can tell how much error there is in clustering. Well-defined ways of exploring error, but not specific number cutoffs. One way to approach it is to do repeated validation - showing that these clusters exist, also in next-years data – less likely to split the dataset into training and validation set.
Success with k-means
How do you determine how successful k-means was?
- calculate how well individuals fit within centroid (Euclidian distance)
- Contextualizing this error is difficult - optimal clustering k=n (a unique cluster for every individual)
- Elbow method: graph average error divided by set of individuals, and look for the elbow.
- Silhouette function - balancing density of a cluster (how close they are to the centroid) with how many points in a cluster.
- Eigen-gap, when they dip - that's the number of clusters you want to go with.
Centroid
What does centroid mean with categorical data? I'm having trouble visualizing it, since it is much more than just two dimensions
Often binarize the data - harder to interpret many different categories. Could use actual values (number of minutes watched). 19-dimensional space.
Hard to interpret what squared error means, relies on number of instances, number of dimensions. Take the numbers for different k-means, and plot them in Excel (Weka doesn't offer it).
How clean are the clusters themselves? Can calculate, Weka doesn't offer it.
Weka doesn't let you extract a list of instances tagged with clusters.
Classification overview
- Predict which cluster a learner will be in based on the data we have on them
- Supervised manner - given training data, attempts to find rules to describe data
- Linear regression - often used to predict grades
J48
C4.5 is an algorithm, J48 is an implementation of the algorithm in Weka.
- Attempts to bisect instance space and recursively work on each proton, stops when each instance of the instance space is in the same class
- Various pruning techniques used to try to make result more generalizable Leads to decision tree of rules
- Predicts categories, not continuous values
- Relatively fast, easy to read rules
- Good single measure of accuracy is Kappa
- between 0-1 for accuracy (can get negative values too, rarely)
- 0.5 - goood? nebulous.
- For more in-depth analysis, look at confusion matrix
- compare classification with prediction.
The problem with verifying this year's prediction with next year's data, is that you don't capture the change from this year to next year.
Considerations
- Unbalanced ata can produce unclear results
- Solutions include:
- using vertical subset of data, excluding categories of students that don't have enough data
- using horizontal subset, to balance groups in training activity
- using synthetic superset of data (eg. SMOTE) to balance groups in the training activity
- Often assumption of independence of attributes
Visualization of generated tree
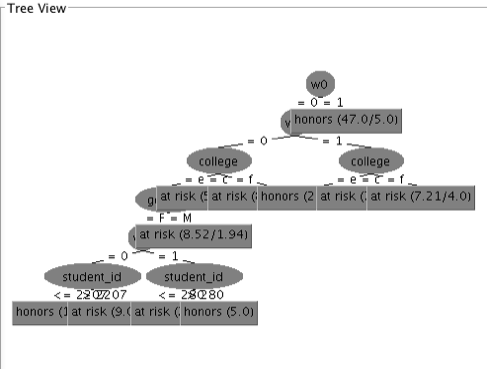
Important to use training and validation set, easy to overfit.
Sharing predictions
PMML is a way of sharing predictations without sharing the underlying data. Could we think of predictions as improveable research objects to be published alongside papers, for others to verify on their data etc?
Problem with having data be comparable:
- distributions of students
- format of data etc
- would need to share pre-processing pipeline (scripts etc) as well
Could work well with comparable data sources like MOOCs, either on the same platform, or using something like MOOCdb to normalize.
Marist College has done experiments with this, documentation.
Other issues
- data cleaning
- attribute selection
- balancing of data input
- ensemble models (combining different models on different sub-categories)
- Chris is currently looking at making it possible to automatically generate models from different LMSes, thinking of all data as timeseries
- Early Alert Project - predict end of term grades based on
- admissions application
- self-reported survey data
- high school grades
- LMS usage data
- actionable predictions
- Zach: clustering and cognitive modeling (Bayesian networks) - finding assistance value of external aids (Khan academy, lecture, etc). Scaling algorithms so they can handle large amounts of data.
- BerkleyX - external researchers can contribute analytics models that can run on data, without conflicting with FERPA
Open data sets
Very difficult in education, because of privacy etc. More available aggregated at school and district level, etc. Datashop from Pittsburgh has open traces from intelligent tutoring systems. Upcoming Open Learning Analytics workshop.

